100
NPS

Stanford University is one of the world's leading research universities. Stanford is known for its entrepreneurial character, drawn from the legacy of its founders, Jane and Leland Stanford, and its relationship to Silicon Valley. Research and teaching stress interdisciplinary approaches to problem solving. Areas of excellence range from the humanities to social sciences to engineering and the sciences. Stanford is located in California's Bay Area, one of the most intellectually dynamic and culturally diverse areas of the nation. Among its major competitors, Stanford University is ranked in 1st place for NPS while Apple is 2nd, and Google is 3rd.
Stanford University's Net Promoter Score (NPS) is a 100 with 100% Promoters, 0% Passives, and 0% Detractors. Net Promoter Score tracks whether Stanford University's customers would recommend using the product based on a scale of -100 to 100.
| 100% | Promoters |
|---|---|
| 0% | Passives |
| 0% | Detractors |
| Summary | Date | Score |
|---|---|---|
Aug 2023 100 | Aug 2023 | 100 |
Stanford University is ranked first for NPS among its competitors. Apple and Google come in second and third, with Meta coming in at #4.
Net Promoter Score (NPS) is a management tool that can be used to gauge the satisfaction of a firm's customer relationships. NPS has been widely adopted as a key metric often linked to the revenue potential of a company’s product or service. The metric is based on customer responses to the question: "On a scale of 0 to 10, how likely are you to recommend the product to a friend?"
Those who respond with a score of 9 to 10 are known as Promoters, and are widely associated with behaviors that create value, including actively encouraging others to use the product or service. Those who respond with a score of 7 or 8 are categorized as Passives, and they are believed to be less likely to exhibit the value-creation traits of Promoters having a largely neutral effect on other consumers. Detractors are those who fall in the score range of 0 to 6 and represent dissatisfied customers of the product sometimes actively recommending against using the product.
Compared to its competitors, Stanford University's NPS is rated right above Apple.
| COMPANY | NPS Score | |
|---|---|---|
| Stanford University | 100 | |
| Apple | 46 | |
42 | ||
| UCSF | 41 | |
| Meta | 9 | |
Customer Loyalty is a strong indicator of whether or not a customer will choose a brand repeatedly over a competitor that offers similar products/services.
100% of Stanford University users/customers answered "Yes" when asked: "Would you consider yourself a loyal user/customer?"
Sign Up to see the full customer demographics data and the people that answered "Yes" when asked "Would you consider yourself a loyal user/customer?"
Compared to its competitors, Stanford University's Customer Loyalty score is rated right above Google.
| COMPANY | Customer Loyalty Score | |
|---|---|---|
| Stanford University | 100% | |
| 87% | ||
| Apple | 86% | |
| Meta | 75% | |
| UCSF | 62% |
Sign Up for Brand Profile PRO to get the full Stanford University Customer Loyalty vs. Competitors data and gain insights into your customers today.
Stanford University has an overall Product Quality score of 5 out of 5 stars rated by its users and customers.
Sign Up to unlock Stanford University's overall Product Quality score rated by its users and customers.
Stanford University’s product quality score is a 5 out of 5 as rated by its users and customers.
Compared to its competitors, Stanford University's Product Quality score is rated right above Apple.
| COMPANY | Product Quality Score | |
|---|---|---|
| Stanford University | 5/5 | |
| Apple | 4.3/5 | |
| 4.1/5 | ||
| UCSF | 3.9/5 | |
| Meta | 3.6/5 |
Sign Up for Brand Profile PRO to get the full Stanford University Product Quality vs. Competitors data and gain insights into your customers today.
Stanford University has a value for money and ROI score of 5 out of 5 stars rated by its users and customers.
Sign Up to unlock Stanford University's overall ROI score rated by its users and customers.
Compared to its competitors, Stanford University's ROI score is rated right above Google.
| COMPANY | Pricing Score | |
|---|---|---|
| Stanford University | 5/5 | |
| 4/5 | ||
| Apple | 4/5 | |
| UCSF | 3.8/5 | |
| Meta | 3.6/5 |
Sign Up for Brand Profile PRO to get the full Stanford University ROI vs. Competitors data and gain insights into your customers today.
Stanford University has an overall Customer Satisfaction score of 100 rated by its users and customers.
Sign Up to see the full customer demographics data and the people that answered "How would you rate your overall satisfaction with the service you received?"
Customer Satisfaction Score (also known as CSAT), is a metric used to quantify how satisfied customers are with a company or brand’s products and services. The Customer Satisfaction Score is based on customers response to the question: “How would you rate your overall satisfaction with the service you received?” The score is calculated using the formula: (The total number answer of “Very Satisfied” and “Satisfied”) ÷ (The total response) x100, and it is generally displayed in percentages. Some of the main benefits of the CSAT for businesses are tracking retention, identifying happy customers and growing relationships, and gaining repeat business to build a sustainable brand.
Compared to its competitors, Stanford University's Customer Satisfaction score is rated right above Apple.
| COMPANY | Customer Satisfaction (CSAT) Score | |
|---|---|---|
| Stanford University | 100% | |
| Apple | 85% | |
| 81% | ||
| UCSF | 78% | |
| Meta | 65% |
Sign Up for Brand Profile PRO to get the full Stanford University Customer Satisfaction vs. Competitors data and gain insights into your customers today.
Stanford University has an overall Customer Service score of 5 out of 5 stars rated by its users and customers.
Sign Up to unlock Stanford University's overall Customer Service score rated by its users and customers.
450 Serra Mall, Stanford, CA 94305
https://www.stanford.edu/
Compared to its competitors, Stanford University's Customer Service score is rated right above Apple.
| COMPANY | Customer Service Score | |
|---|---|---|
| Stanford University | 5/5 | |
| Apple | 4.2/5 | |
| 4/5 | ||
| UCSF | 3.8/5 | |
| Meta | 3.5/5 |
Sign Up for Brand Profile PRO to get the full Stanford University Customer Service vs. Competitors data and gain insights into your customers today.
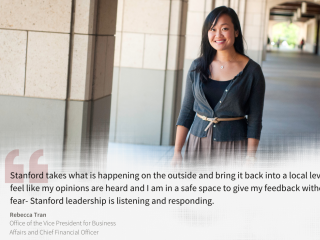
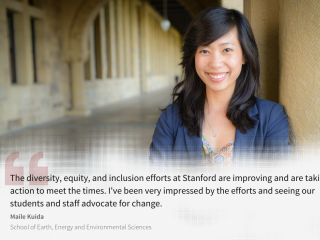
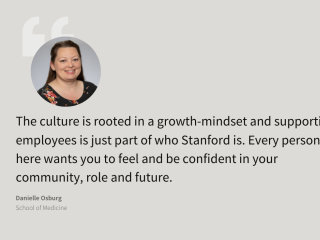
Stanford University has a 4.6/5 stars for its overall company culture rated by their employees

In the Top 5% of Similar Sized Companies on Comparably.


Stanford University scored a 100 for Net Promoter Score and a 50 for Employee Net Promoter Score. NPS gauges how likely a customer of Stanford University would recommend the brand to a friend. ENPS measures how likely Stanford University employees would recommend working at Stanford University to a friend.
| 100% | Promoters |
|---|---|
| 0% | Passive |
| 0% | Detractors |
| 63% | Promoters |
|---|---|
| 24% | Passive |
| 13% | Detractors |


