


Tenable Claimed Company
Tenable® is the exposure management company, exposing and closing the cybersecurity gaps that erode business value, reputation and trust. The company’s AI-powered exposure management platform radically unifies security visibility, insight and action across the attack surface, equipping modern organizations to protect against attacks from IT infrastructure to cloud environments to critical infrastructure and everywhere in between. By protecting enterprises from security exposure, Tenable reduces business risk for over 40,000 customers around the globe.
Learn more at tenable.com. read more
Tenable CEO & Leadership Team Ratings
Mark Thurmond and Steve Vintz and the Tenable leadership team are scored an A+ by 611 employees placing it in the Top 5% of companies sized 1,001-5,000 Employees on Comparably. The Leadership score includes details about how employees evaluate their executive team, CEO and manager.
Men have higher ratings for their leadership team compared to Men. the Admin department and the Business Development department have the most favorable ratings for their leadership team compared to African American/Black employees and the Product department.
Based on 3528 ratings, the Leadership score of 91/100 combines employee feedback on their CEO (92/100), Manager (89/100), and Executive Team (92/100).
Mark Thurmond and Steve Vintz Tenable CEO Rating
Top 5% Compared to other companies of similar size in Washington, DCA+
92 / 100
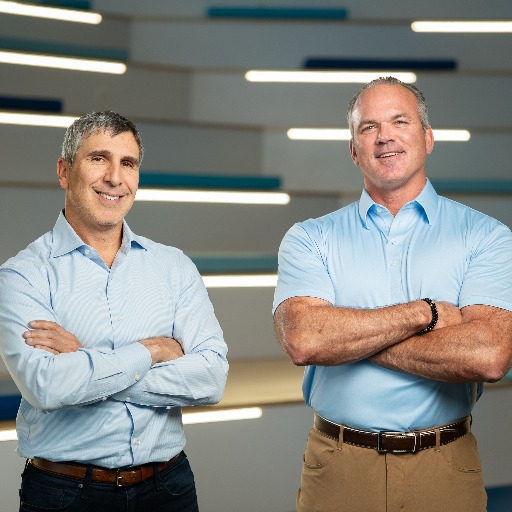 Mark Thurmond and Steve Vintz the CEO of Tenable received an average score of 92 from Tenable employees.
Female employees at Tenable rate the CEO the highest.
The Design department at Tenable rate the CEO the highest, while Product department rates the CEO lowest.
Employees who have been at Tenable for 5 to 10 Years rate the CEO the highest.
83
Less Than 1 Year
40
1 to 2 Years
73
2 to 5 Years
87
5 to 10 Years
Asian or Pacific Islander employees at Tenable rate the CEO the highest.
Tenable Manager Rating
Top 5% Compared to other companies of similar size in Washington, DCA+
89 / 100
Tenable Executive Team Rating
Top 5% Compared to other companies of similar size in Washington, DCA+
92 / 100
×